How to Evaluate Mutual Fund Consistency: Beyond 1-Year and 3-Year Returns
Published by Anand Rathi Wealth Limited (ARWL) | NSE500-Listed Wealth Firm | Est. 2002
Association of Mutual Funds in India (AMFI) - Registered Mutual Fund Distributor | ARN: 111569
Published: September 1, 2026
When investors evaluate equity funds, the first data points they routinely examine are trailing one-year and three-year returns. While these trailing point-to-point numbers provide a quick snapshot of recent performance, they fail to reveal whether a fund has delivered results consistently, how much structural risk was undertaken, or how the scheme might behave across changing market environments. A fund can easily surge to the top of a short-term leaderboard simply because of a temporary rally in a specific sector, market capitalization segment, or narrow investment style. However, recent outperformance does not mean that the scheme aligns with an investor's long-term wealth goals.
For high-net-worth individuals (HNIs) looking to evaluate mutual fund consistency in India, the evaluation process must move past superficial trailing returns. Achieving predictable outcomes requires analyzing fund behavior across rolling time horizons, full market cycles, risk-adjusted parameters, downside drawdowns, and underlying portfolio structures.
Mutual fund consistency is the quantitative measure of a fund's ability to deliver dependable, repeatable performance across multiple overlapping time periods and market cycles, while maintaining strict alignment with its stated investment mandate and risk parameters.
Why 1-Year and 3-Year Returns Can Be Misleading
A single one-year trailing return is heavily distorted by prevailing market sentiment during that specific window. If mid-cap, small-cap, or cyclical sector stocks experience a rapid liquidity rally, funds maintaining heavy exposure to those volatile segments will temporarily jump to the top of category rankings.
Similarly, three-year trailing returns are sensitive to endpoint bias, meaning the performance calculation is heavily influenced by the chosen starting and ending dates. A fund can display an attractive three-year compound annual growth rate (CAGR) simply because the calculation window began near a sharp market low or ended immediately after a steep market rally.
To understand why relying on a single fixed timeframe leads to flawed conclusions, consider the historical volatility profile of the Nifty 50 benchmark across a 26-year observation window:
Historical Volatility Baseline: Nifty 50 Return Dispersion (FY 2000-01 to FY 2025-26)
(Source: Anand Rathi Wealth Research. Data compiled as of June 29, 2026. Past performance figures serve as historical observation markers and do not guarantee future returns.)
The difference between the weakest and strongest annual returns demonstrates how strongly recent performance can be influenced by the period selected. A fund evaluated after a broad market rally may appear exceptionally consistent, while the same fund assessed after a correction may appear weak.
Point to point returns answer only one question: How much did the fund return between two specific dates?
They completely fail to explain:
- How frequently the fund outperformed its benchmark across intermediate windows.
- How effectively the fund preserved capital during severe market drawdowns.
- How much price volatility investors had to endure to achieve the final return.
- Whether performance was driven by broad strategy execution or concentrated stock bets.
- Whether the underlying investment process remained stable over time.
A rigorous evaluation must examine the operational journey behind the return, rather than relying on a static final number.
12 Strategic Criteria to Measure Mutual Fund Consistency
1. Examine Rolling Returns Across Overlapping Windows
Rolling returns measure fund performance across multiple overlapping periods instead of relying on one fixed starting date and one fixed ending date.
For example, instead of examining only the latest 3-year return, investors can study every possible 3 year period within a longer time frame. This provides a clearer view of how frequently the fund delivered competitive outcomes.
Rolling returns can help investors understand:
- The frequency of benchmark outperformance
- The difference between the fund's strongest and weakest periods
- Whether performance was dependable or driven by one favourable phase
- The probability of achieving a reasonable outcome over the selected holding period
A fund delivering moderate but dependable outcomes across several periods may be more consistent than a fund that occasionally generates exceptional returns but also experiences prolonged underperformance.
2. Compare Performance Across Market Cycles
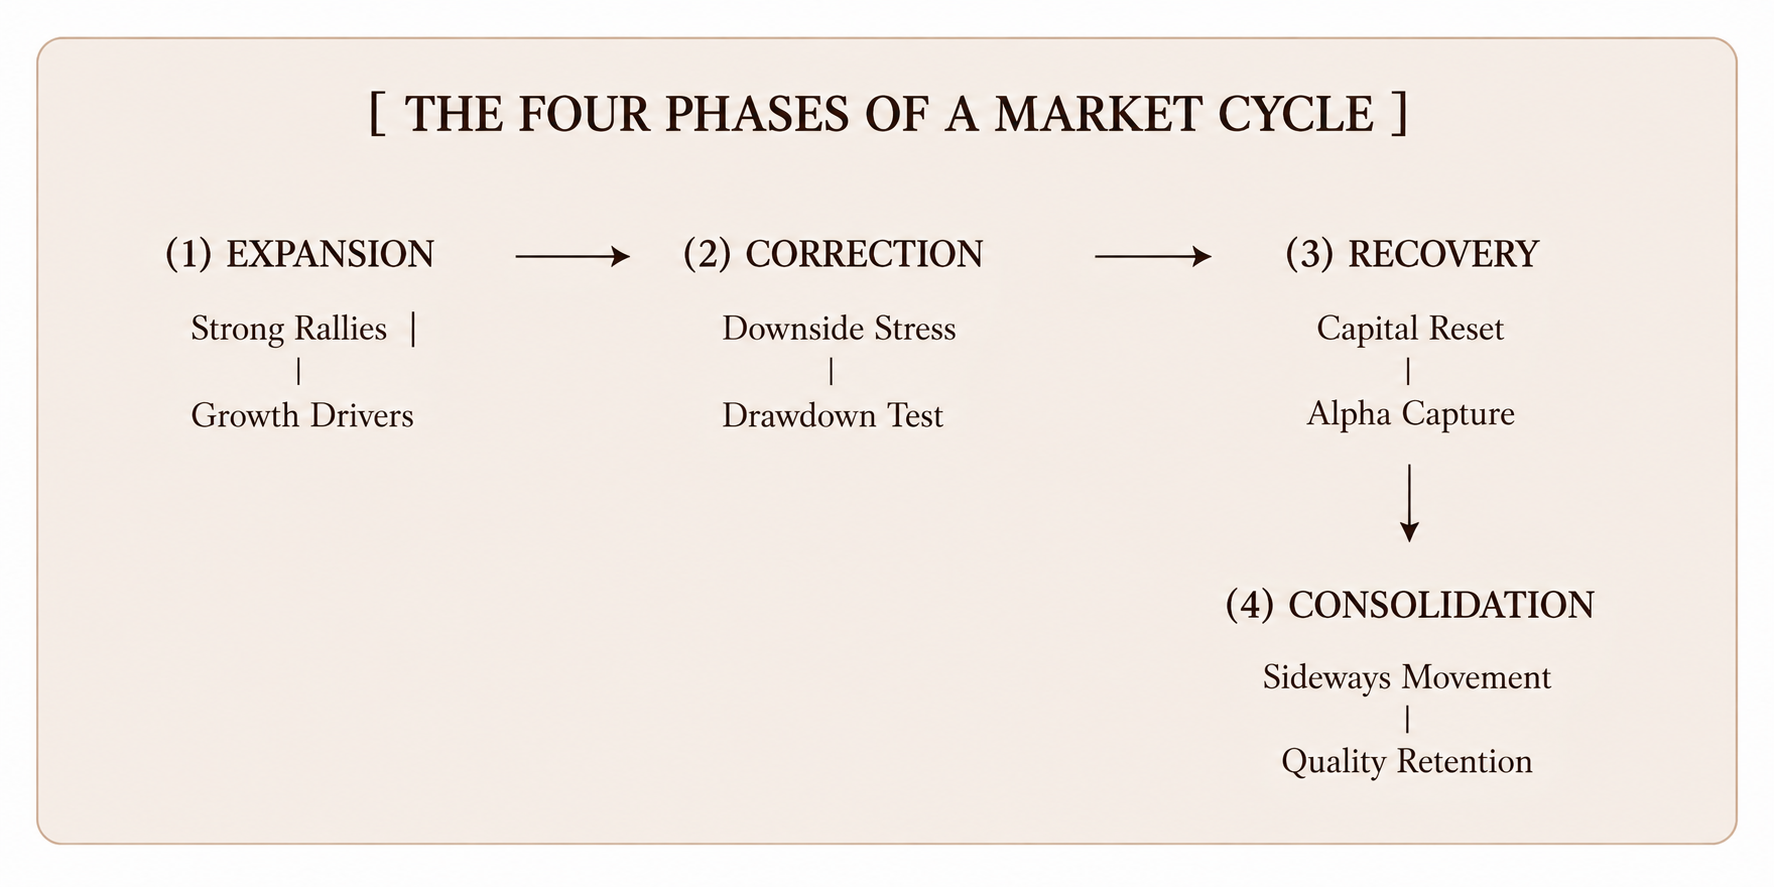
Markets move through expansion, correction, recovery and consolidation phases. A mutual fund should therefore be evaluated across more than one type of market environment.
Investors should examine how the fund performed during:
- Strong market rallies
- Broad market corrections
- Periods of high volatility
- Sideways markets
- Different interest rate and liquidity conditions
Some funds perform strongly during rising markets because they take greater exposure to high growth or high volatility companies. Other funds may not lead during a rally but may protect portfolio value more effectively during a correction.
Consistency does not mean that a fund must outperform during every market phase. It means that its performance should remain broadly aligned with its investment approach and category characteristics.
3. Evaluate Downside Protection and Recovery Velocity
While investors naturally focus on upside participation during bull markets, downside capital preservation is equally critical for long-term wealth compounding.
Capital preservation during drawdowns matters because portfolio losses and gains are mathematically asymmetrical. A portfolio that declines by 20% requires a 25% subsequent gain just to break even. If a drawdown deepens to 40%, the required recovery gain jumps to 66.7%. The asymmetry of portfolio drawdowns:
- A 10% drawdown requires an 11.1% gain to break even.
- A 20% drawdown requires a 25.0% gain to break even.
- A 30% drawdown requires a 42.9% gain to break even.
- A 50% drawdown requires a 100.0% gain to break even.
When auditing downside behavior, wealth managers must measure:
- Maximum Drawdown: The peak-to-trough decline experienced during major market panics.
- Downside Capture Ratio: The percentage of benchmark losses the fund absorbed during down months.
- Recovery Velocity: The time required for the fund's Net Asset Value (NAV) to reclaim its previous peak.
4. Study Risk-Adjusted Efficiency Ratios
Two schemes can generate identical 12% annualized returns while operating under very different risk profiles. One fund might achieve that return through a diversified portfolio of market-leading companies, while another reaches the same number by taking concentrated bets in volatile, illiquid small-cap stocks.
Evaluating risk-adjusted returns allows wealth owners to determine whether a fund's outperformance stems from manager skill or un-hedged risk exposure. Key quantitative metrics include:
- Standard Deviation: Measures total return volatility around the fund's historical average.
- Sharpe Ratio: Measures excess return generated per unit of total risk (Standard Deviation).
- Sortino Ratio: Measures excess return generated relative strictly to downside volatility, ignoring upward price movements.
- Jensen's Alpha: Calculates the net value added by the fund manager beyond what benchmark market risk (Beta) would have produced.
5. Benchmark Against the Correct Peer Group
A fund must be compared with an appropriate benchmark and with other funds following a similar investment mandate.
Comparing a small cap fund with a large cap fund provides limited insight because the two categories have different investment universes, earnings cycles, volatility levels and return characteristics.
The variation in earnings growth across market capitalisation segments illustrates why category appropriate mutual fund comparison matters.
(Source: Anand Rathi Wealth Research. Data reflects FY26 weighted corporate earnings expectations.)
A mid cap fund may appear significantly stronger than a large cap fund during a period of faster mid cap earnings growth. However, this does not automatically make it more consistent or more suitable.
A meaningful comparison should examine:
- Performance against the stated benchmark
- Performance against the category average
- Risk taken relative to category peers
- Consistency of ranking across multiple periods
- Performance across different market conditions
During periods when mid-cap corporate earnings expand rapidly (e.g., 21.3% vs. 3.2% for large caps), mid-cap mutual funds will naturally report higher absolute returns than large-cap funds. However, this cyclical divergence does not automatically make mid-cap funds more "consistent" or structurally safer. A meaningful peer evaluation must compare the scheme against its explicit category peers and benchmark indices, tracking performance across shifting sector cycles. To explore how macro economic expansion drives long-term earnings, read our analysis on
India's long term equity story and what the data says about the next decade.6. Audit Portfolio Concentration and Overlap Risks
Strong recent performance may sometimes be driven by concentrated exposure to a few stocks, sectors or market segments.
Investors should examine:
- Top 10 Stock Weighting: The total capital concentrated in the fund's ten largest positions.
- Sector Exposure Limits: High exposures to single cyclical sectors (e.g., Financials or IT).
- Cross-Fund Stock Overlap: Duplication across existing portfolio holdings.
If an investor holds three separate equity funds that secretly own identical large-cap stocks, the portfolio carries significant concentration risk. To learn how to detect and eliminate duplicate stock holdings across your portfolio, see our structural guide on
mutual fund diversification beyond fund categories.
7. Monitor for Style Drift and Mandate Shifts
A fund may initially be selected for a particular role but gradually change its portfolio characteristics.
For example, a fund expected to provide relatively stable large company exposure may increase its allocation to mid-sized businesses. Similarly, a diversified fund may become increasingly dependent on a few sectors.
Investors should evaluate whether the fund continues to follow its stated investment mandate.
Common examples of style drift include:
- A large-cap fund quietly adding mid-cap and small-cap stocks to boost short-term trailing returns.
- A value-oriented fund purchasing high-multiple growth stocks at market peaks.
- A diversified multi-cap scheme concentrating capital into a single thematic sector.
- Style drift alters the fund's risk profile, often leaving an estate exposed to unintended volatility. A truly consistent scheme maintains its declared investment mandate, enabling reliable portfolio alignment.
A consistent fund should demonstrate reasonable continuity in its investment process, even when individual holdings change.
8. Verify the Repeatability of the Investment Process
Consistency is not created only through stock selection. It is also influenced by the quality and repeatability of the fund's investment process.
Investors should evaluate:
- Stock Selection Methodology: Clear rules defining how companies enter and exit the fund's universe.
- Position Sizing Rules: Strict risk controls governing maximum capital exposure per company and sector.
- Key-Person Dependency: Whether performance relies heavily on a single star manager or an institutional research process.
A process-driven scheme offers higher predictability than a fund reliant on discretionary market timing.
9. Evaluate the Fund's Specific Role in Your Portfolio
The best performing mutual fund is not automatically the most suitable fund.
Every fund should perform a defined role within the portfolio, such as long-term growth, diversification, relative stability or liquidity. Consider an investor seeking to create a retirement corpus of ₹5 crore over the next 30 years. Based on the current portfolio trajectory, the investor is expected to accumulate only around ₹2 crore, leaving a shortfall of approximately 60%.
In such a situation, simply selecting the latest top performing mutual fund may not solve the underlying problem. Instead, the portfolio needs to be constructed around the required outcome.
At Anand Rathi Wealth, the approach is to build a structured basket of 14 mutual funds, with diversification across categories and a defined role for each fund in the portfolio. The objective is to create a portfolio aligned to the investor's required return, risk and time horizon.
The purpose of mutual fund selection, therefore, is not to chase maximum returns. It is to construct a portfolio that improves the probability of achieving clearly defined wealth goals.
12. Enforce a Structured, Periodic Review Schedule
Consistent mutual funds should not be reviewed every time markets fluctuate. Frequent changes can lead to performance chasing and unnecessary portfolio disruption.
Instead, portfolios should undergo a structured, formal review annually to analyse:
- Rolling return performance against category benchmarks.
- Downside capture ratios and maximum drawdowns.
- Portfolio stock overlap and sector concentration limits.
- Adherence to the fund's declared investment style.
- Alignment with overall family wealth goals.
A fund may require closer examination when there is sustained underperformance across multiple periods, a significant change in strategy, persistent style drift or a weakening of its role within the portfolio.
Conclusion: Shifting from Trailing Numbers to an Objective Process
The true consistency of a mutual fund cannot be determined through a single, isolated performance figure. A top-ranked fund over a short trailing window may simply reflect temporary sector tailwinds, aggressive risk taking, or endpoint bias.
A rigorous, objective assessment must examine how frequently a fund delivers competitive outcomes across rolling horizons, how effectively it protects capital during market drawdowns, the stability of its risk-adjusted metrics, and how cleanly it fits within your broader wealth goals. By prioritizing structural process, downside protection, and repeatability over short-term leaderboards, high-net-worth investors can construct resilient portfolios that compound wealth predictably across every phase of the market cycle.
About Anand Rathi Wealth
This article is published by
Anand Rathi Wealth Limited (ARWL), an NSE500-listed wealth firm established in 2002. ARWL works with 14,309 client families across India and abroad, managing assets of ₹1,08,377+ crores across 19+ cities in India, alongside a dedicated international presence in Dubai and
the UK.ARWL operates as a CFO for personal wealth, bringing objective-driven portfolio construction, an uncomplicated process, and a long-term perspective that prioritises consistency of outcomes over short-term performance.
Our Approach to Investment Insights
At Anand Rathi Wealth, every insight is grounded in data, structured around a clear investment objective, and designed to be understood without jargon. The goal is not to impress—it is to inform.
The insights in this article are designed to encourage evaluation of consistency over isolated returns, highlight the value of structured portfolio frameworks, and support informed decision-making.
This article has been reviewed for factual accuracy by Anand Rathi Wealth Limited's insights function. This content is for informational and educational purposes only. It is designed to help readers make informed financial decisions.
Disclaimer
This article is for informational and educational purposes only. The fund and scheme names used in this article are illustrative examples for explaining diversification and overlap. They should not be treated as investment action, product endorsement or a promise of future performance.
FAQs
Rolling returns measure a fund's performance across multiple overlapping time horizons (e.g., hundreds of overlapping 3-year periods over a decade). This approach eliminates endpoint bias where a calculation is skewed by an unusually high or low starting date and reveals how consistently a scheme delivered competitive returns across different market environments.