What the data says about investing in the country's growth over the next decade
Published by Anand Rathi Wealth Limited (ARWL) | NSE500-Listed Wealth Firm | Est. 2002
Association of Mutual Funds in India (AMFI) - Registered Mutual Fund Distributor | ARN: 111569
Published: September 1, 2026
India's equity market is frequently evaluated through short term events such as quarterly corporate earnings reports, foreign portfolio investor flows, central bank interest rate expectations, and temporary market corrections. While these cyclical factors can influence market movement over short horizons, they do not explain the foundational long-term opportunity residing in Indian equities. For high-net-worth individuals (HNIs), ultra-HNIs, and senior business leaders, the strategic question is whether India's economic trajectory can translate into sustained corporate earnings and predictable multi-decade wealth creation.
To evaluate this long-term potential, wealth owners must look past temporary market noise and focus on empirical economic drivers. The historical correlation between nominal gross domestic product (GDP) and Nifty 50 growth offers a reliable macroeconomic foundation. Current forward earnings expectations and index valuation metrics provide an additional layer of analytical clarity. Concurrently, a third structural catalyst is unfolding across domestic markets: the shift of Indian household savings from physical assets toward market-linked financial instruments. Together, these core drivers provide a data-backed perspective on the Indian stock market outlook over the coming decade.
What Is India's Long Term Equity Growth Story?
India's long term equity growth story refers to the potential of Indian equities to compound over extended periods, supported by sustained nominal GDP growth, rising corporate earnings, reasonable market valuations and the gradual movement of household savings towards financial assets.
The decade ahead will not move in a straight line. Market corrections, changes in earnings expectations and periods of uncertainty will remain part of equity investing. The long-term opportunity must therefore be evaluated through economic growth, earnings, valuations and investor participation rather than short term sentiment alone.
Why Nominal GDP Matters for Long Term Equity Returns
Evaluating equity performance across multi-year horizons requires connecting index growth directly to macroeconomic expansion. Nominal GDP combines two distinct components: real GDP growth, which measures the physical increase in the production of goods and services, and inflation, which reflects price changes across the economy.
Together, these two economic forces define the nominal revenue environment in which commercial enterprises operate. When an economy expands in nominal terms, corporate top-line revenues and bottom-line earnings expand over time. Historical market data confirms that India's nominal GDP growth rate and the annualized returns of the benchmark Nifty 50 index have remained closely aligned over an extended multi-decade period.
To examine how economic expansion drives equity market performance across distinct economic cycles, consider the historical alignment between nominal GDP and Nifty 50 compounding:
Macroeconomic Alignment: Nominal GDP Growth and Nifty 50 Performance Since 1999
(Source: National Stock Exchange of India [NSE], Ministry of Statistics and Programme Implementation [MOSPI]. Annualized CAGR figures compiled across 27 fiscal years.)
Between Apr'99 and Mar'26, India recorded real GDP growth of 6.3% and inflation of 5.3%. This resulted in nominal GDP growth of 11.6%. Over the same period, the Nifty 50 grew at 11.9%. The similarity between these two numbers is significant.
The mathematical proximity of these two long term figures is highly significant. It demonstrates that across multi-decade timelines, equity market expansion broadly mirrors the nominal expansion of the underlying economy. While the Nifty 50 will not match nominal GDP growth in every single year due to short term sentiment swings, the historical data proves that economic growth and equity market compounding move in the same structural direction over extended horizons.
What India's Expected Economic Growth Means for Future Returns
Looking ahead to the next five years, macroeconomic projections indicate that India's real GDP is expected to grow at a steady rate of 6% to 7% per annum, while domestic inflation is projected to remain anchored within a 4% to 5% range. Combining these real growth and inflation expectations yields an estimated nominal GDP growth rate of approximately 11% to 12% per annum.
Based on the verified historical relationship between nominal GDP expansion and market performance, the Nifty 50 is projected to compound at approximately 11% to 13% CAGR over the next five years. This projection provides an empirical economic foundation for building an equity portfolio.
The expected long-term return is not reliant on speculative expansion of valuation multiples. Rather, it is anchored directly in the physical expansion of India's domestic economy and the corporate earnings generated by Indian businesses. To understand how these long-term market projections are integrated into a structured strategy, review our comprehensive framework on
portfolio construction for HNIs and building a foundation for long term wealth.1. Do Current Equity Valuations Appear Reasonable?
Economic growth creates an opportunity, but the price paid for future earnings remains equally important. A strong business or economy may still produce disappointing investment outcomes if the starting valuation is significantly higher than the earnings it can reasonably generate.
The current valuation framework compares index levels as on 29-Jun-26 with estimated fair values based on reasonable P/E multiples and expected 1 year forward earnings.
Index Valuation Audit: Prevailing Levels vs. 1-Year Forward Fair Value (As of June 29, 2026)
(Source: Anand Rathi Wealth Research. 1-year forward EPS estimates cover the period ending June 29, 2027. Negative froth percentages indicate index trading levels below calculated fair value.)
Based on the earnings and valuation assumptions used in this calculation, all four indices were below their estimated fair values as on 29-Jun-26.
- The NIFTY 50 was at 23,946, compared with an estimated fair value of 26,033. This resulted in a froth calculation of -8.0%.
- The NIFTY 100 was at 24,977, compared with an estimated fair value of 28,399, resulting in a froth calculation of -12.1%.
- The Midcap 150 and Small cap 250 were also below their estimated fair values by -10.1% and -15.6%, respectively.
The negative froth figures indicate that the prevailing index levels were below the fair values derived from the stated reasonable P/E multiples and expected earnings. However, fair value is not permanent. It changes when earnings expectations or the P/E multiple considered reasonable changes. The calculation must therefore be viewed as an earnings-based framework rather than a guaranteed index target.
2. Why Earnings Matter More Than Short Term Market Sentiment
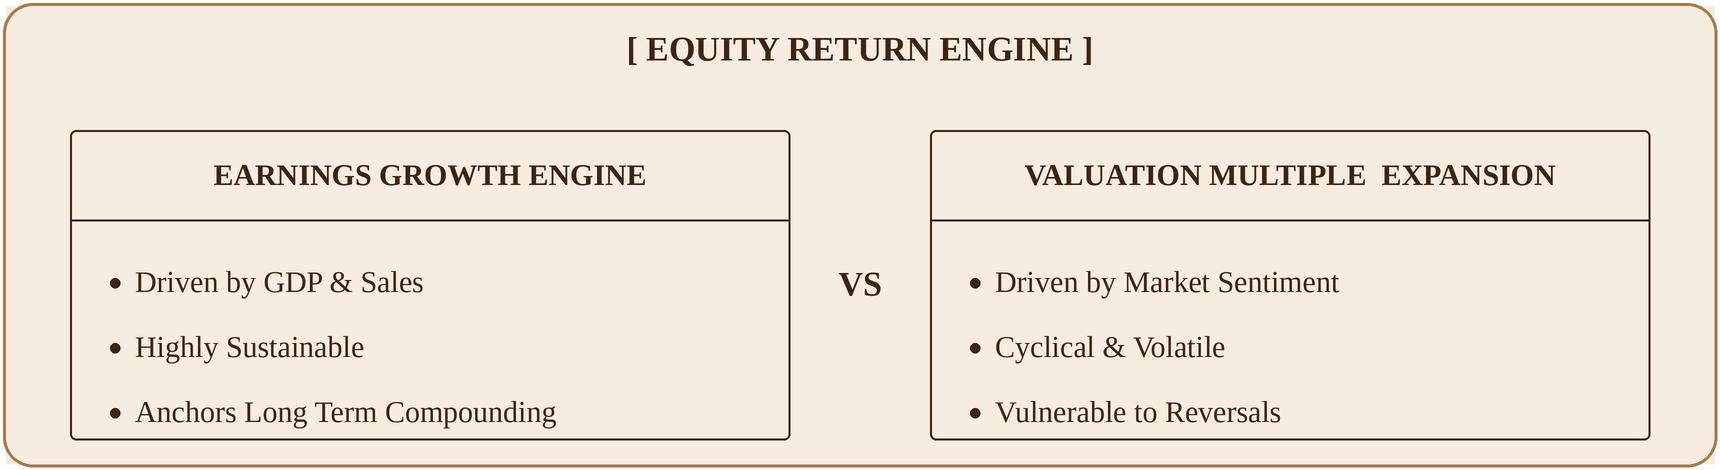
Index levels can rise because of two broad factors. The first is earnings growth. The second is an increase in the valuation multiple that investors are willing to pay for those earnings.
Returns driven primarily by earnings growth are generally more sustainable than returns driven only by expanding valuation multiples. If earnings grow as expected, the estimated fair value may remain supported. If earnings disappoint, the fair value may need to be revised. Similarly, if the market begins to assign a lower or higher P/E multiple, the calculated fair value will change.
This is why a long-term view on India's economic growth must ultimately be supported by the earnings delivered by Indian companies.
India's Household Wealth Creates a Large Structural Opportunity
The long-term opportunity in Indian equities is not dependent only on GDP and earnings. It is also linked to where Indian households hold their wealth.
India's mutual fund AUM has crossed ₹85 lakh crore, according to AMFI. Mutual fund AUM to GDP increased from 7% in FY14 to 21% by 2025. Reaching 50% of GDP would require a 2.5x jump in AUM relative to GDP.
At India's current GDP growth rate, the required mutual fund AUM would be approximately ₹175 lakh crore. The composition of Indian household wealth helps explain the scale of the opportunity.
Indian Household Savings Distribution: Comprehensive Asset Footprint (As of March 2026)
(Source: Anand Rathi Wealth Research compilation based on official financial flow data as of March 2026.)
Of India's aggregate household wealth base of ₹1,463 lakh crore, physical assets dominate, representing ₹920 lakh crore or 62.9% of total domestic holdings. Physical gold accounts for ₹410 lakh crore (28.0%), while residential and commercial real estate accounts for ₹400 lakh crore (27.4%).
In contrast, total financial assets stand at ₹543 lakh crore, representing 37.1% of household wealth. Equity mutual funds account for only ₹27 lakh crore, or 1.8% of total household wealth, while direct equity holdings represent ₹51 lakh crore (3.5%).
These empirical data points highlight a substantial structural imbalance: Indian households maintain heavy over-exposure to physical assets relative to productive market-linked financial instruments.
Even a small change in household asset allocation can translate into significant long term capital flows. For instance, suppose just 1% of household wealth were to shift specifically into mutual funds. Such a shift could potentially translate into approximately ₹14 lakh crore to ₹15 lakh crore of additional capital flowing into the mutual fund industry.
This illustrates the scale of opportunity that even a marginal increase in household allocation towards mutual funds can create over time.
This structural shift does not imply that Indian households will abandon physical assets entirely. Gold and real estate serve deeply entrenched cultural, consumption, and collateral functions. Rather, the structural opportunity lies in incremental re-allocation. As household incomes rise, digital financial infrastructure expands, and financial literacy deepens, a larger share of fresh incremental savings will naturally flow into regulated, market-linked assets.
Existing Networks Could Support Wider Participation
India already has a large distribution and banking network through post offices and Jan Dhan accounts. However, access to mutual fund investing through these networks remains limited. The challenge is not always reaching potential investors. The existing financial network already reaches a large part of the population. The opportunity lies in making market linked financial products accessible through uncomplicated processes and appropriate investor education.
Key Drivers of the Coming Decade
India's long term equity story is supported by multiple structural drivers that extend beyond top-line economic growth. Over the next decade, market performance will be shaped by five interconnected forces:
- Sustained Corporate Earnings Expansion: Nominal GDP growth of 11% to 12% providing a reliable top-line revenue foundation for corporate India.
- Financialization of Household Savings: The structural shift of incremental domestic wealth from low-yielding physical assets into market-linked instruments.
- Expansion into B30 Markets: Growing mutual fund adoption across Beyond-30 (B30) cities, broadening the domestic investor base.
- Institutionalization of Systematic Investing: High monthly Systematic Investment Plan (SIP) inflows creating a stable counterweight to foreign institutional investor (FII) volatility.
- Distribution Network Integration: Expanding market access across traditional banking platforms, postal networks, and digital ecosystems.
These drivers reinforce one another. Economic growth expands household savings, higher savings accelerate financialization, deeper domestic participation stabilizes capital markets, and corporate India utilizes this domestic capital base to expand capacity and generate earnings. This self-reinforcing cycle underpins India's multi-decade equity outlook.
Conclusion: Process-Driven Execution for Long Term Wealth
India's macroeconomic trajectory offers a compelling foundation for long term equity compounding. Driven by projected nominal GDP growth of 11% to 12%, reasonable forward valuations, and the ongoing shift of household savings into financial assets, domestic capital markets are positioned for structural expansion over the coming decade.
However, capturing this growth requires moving beyond short-term market timing. Wealth owners must adopt a disciplined, process-driven framework that links equity allocations directly to personal risk capacity, time horizons, and liquidity requirements. By building an objective asset structure, investors can navigate temporary market cycles with confidence and participate fully in India's long term economic growth story.
About Anand Rathi Wealth
This article is published by
Anand Rathi Wealth Limited (ARWL), an NSE500-listed wealth firm established in 2002. ARWL works with 14,309 client families across India and abroad, managing assets of ₹1,08,377+ crores across 19+ cities in India, alongside a dedicated international presence in Dubai and
the UK.ARWL operates as a CFO for personal wealth, bringing objective-driven portfolio construction, an uncomplicated process, and a long-term perspective that prioritises consistency of outcomes over short-term performance.
Our Approach to Investment Insights
At Anand Rathi Wealth, every insight is grounded in data, structured around a clear investment objective, and designed to be understood without jargon. The goal is not to impress, it is to inform. The insights in this article are designed to encourage evaluation of consistency over isolated returns, highlight the value of structured portfolio frameworks, and support informed decision-making.
This article has been reviewed for factual accuracy by Anand Rathi Wealth Limited's insight's function. This content is for informational and educational purposes only. It is designed to help readers make informed financial decisions. To understand how this content is created and reviewed, visit our
Content Standard Page.Disclaimer
This article is for informational and educational purposes only. The fund and scheme names used in this article are illustrative examples for explaining diversification and overlap. They should not be treated as investment action, product endorsement, or a promise of future performance.
FAQs
India's long term equity story is supported by projected nominal GDP growth of 11% to 12%, expanding corporate earnings, reasonable forward valuations across major index benchmarks, and the structural shift of household savings from physical assets (gold and real estate) into regulated financial assets.