What Is Risk Adjusted Return and Its Impact on Your Long-Term Portfolio?

Return Is Only One Part of the Investment Story
Investors often compare investments by looking at the return generated over 1,3 or 5 years. However, return alone does not reveal how much risk was taken to generate that return. Risk refers to the possibility that the actual return from an investment may be lower than expected. It can also include the possibility of losing part or all of the invested capital. Since both return and risk are measurable, they should be evaluated together rather than in isolation. This is where risk-adjusted return becomes important.
Risk adjusted return is a quantitative metric that measures the total return generated by an investment relative to the amount of risk taken to achieve it. It allows wealth owners to evaluate whether higher performance stems from superior manager skill or simply from taking on excessive, un-hedged market volatility.
Evaluating Performance Beyond Absolute Numbers?
Risk adjusted return calculates the yield generated by a capital deployment in direct proportion to the underlying risk taken. To visualize this dynamic, consider a comparative evaluation of two distinct investment options:
| Asset Vehicle |
Annualized Absolute Return |
Portfolio Volatility (Risk Vector) |
Risk Efficiency Assessment |
| Fund A |
12% |
10% |
Higher absolute return, but lower risk efficiency per unit of volatility. |
| Fund B |
10% |
5% |
Superior Risk Adjusted Performance. Delivers double the return per unit of risk. |
(Source: Anand Rathi Wealth Research Team)
Fund A delivered a higher absolute return on paper. However, Fund B generated significantly more return for every unit of risk taken. For long-term investors, this distinction is critical. An investment that achieves returns through extreme fluctuations is significantly harder to hold calmly through complete market cycles, often leading to costly emotional rebalancing.
Why Identical Returns Can Produce Different Investor Experiences
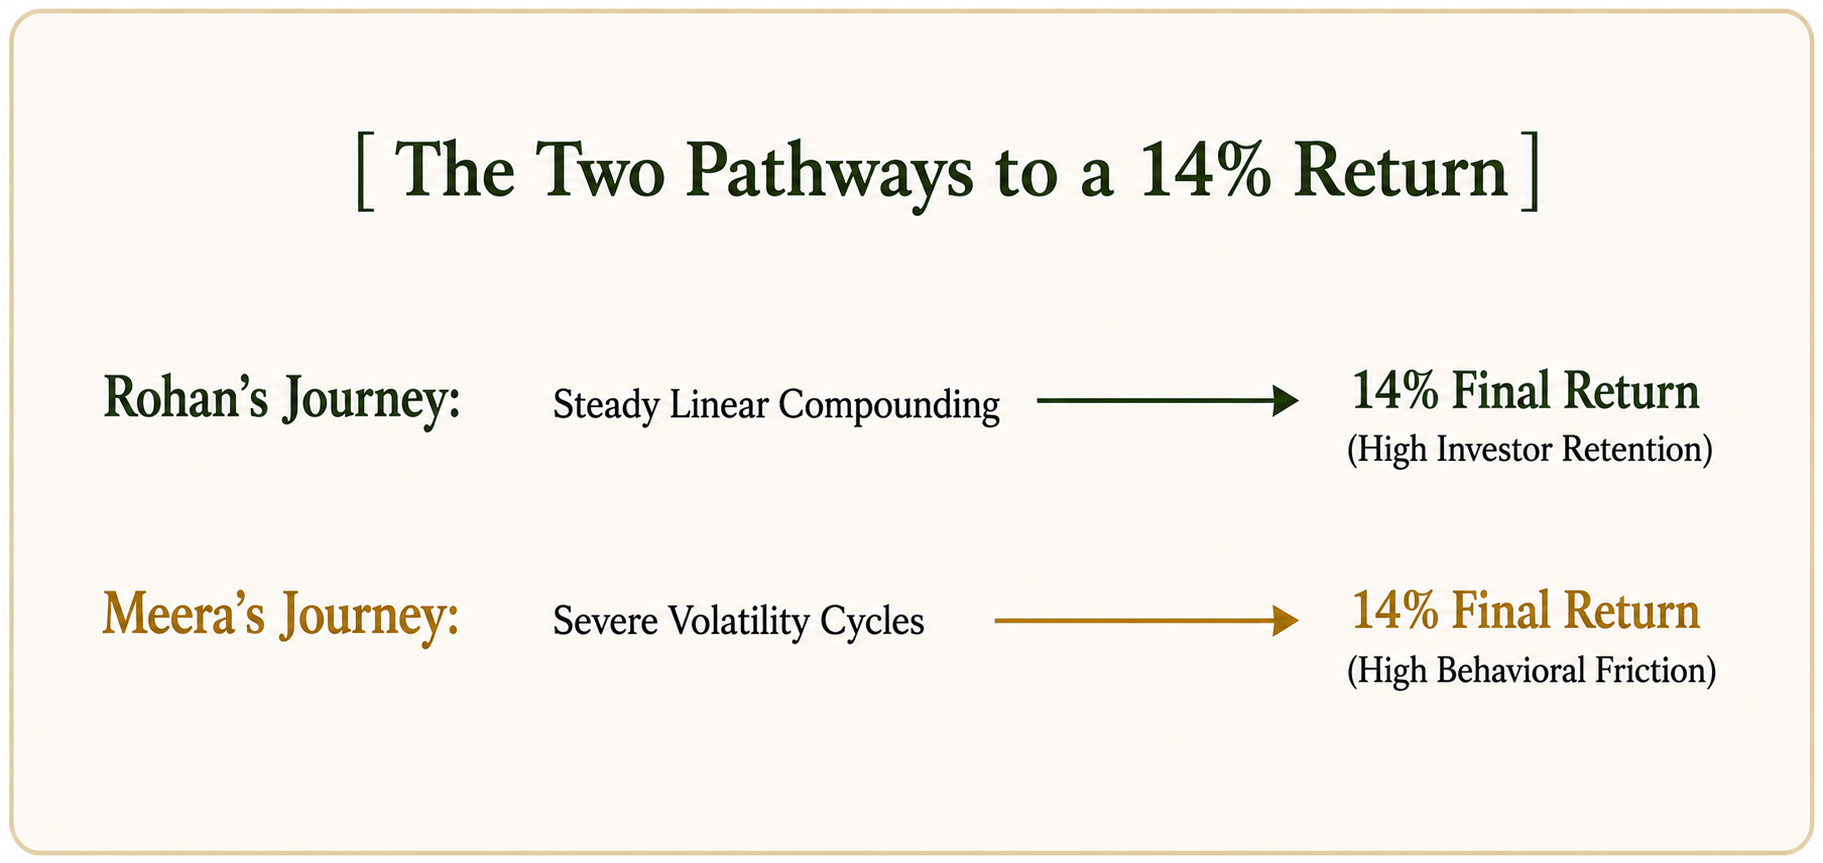
Consider two investors, Rohan and Meera. Both earned an annual return of
14% over three years. Rohan’s fund grew relatively steadily with limited declines. Meera’s
fund experienced sharp gains and frequent corrections before reaching the same 14% return.
Although their destination was identical, their experience was fundamentally different. Deep, frequent
drawdowns test investor discipline, often prompting individuals to stop systematic plans, switch funds, or
liquidate assets during market bottoms. The pathway through which returns are generated directly determines
whether an investor stays the course long enough for compounding to take effect.
Five Core Metrics for Measuring Portfolio Risk
Standard Deviation
Standard deviation measures how far investment returns may move from their average return. For example, a
mutual fund with an average return of 12% and a standard deviation of
8% may generally experience returns ranging from approximately 4% to
20%. A lower standard deviation usually indicates a more consistent return experience,
while a higher standard deviation indicates wider fluctuations.
Beta
Beta measures how an investment is expected to move in relation to the broader market. It helps investors
understand whether a fund is likely to experience more or less movement than its benchmark. Standard
deviation measures total fluctuation, while beta measures sensitivity to market movement.
Sharpe Ratio
The Sharpe Ratio measures how much excess return an investment generates for every unit of total risk taken.
In the Rohan and Meera example, both funds delivered an annual return of 14%. However:
| Investor Profile |
Annualized Absolute Return |
Portfolio Sharpe Ratio |
Structural Performance Interpretation |
| Rohan |
14% |
100% |
Sound risk efficiency; adequately compensated for volatility. |
| Meera |
14% |
44% |
Inefficient risk ratio; excessive volatility for the return achieved. |
Rohan’s higher Sharpe Ratio indicates that his fund generated the same return with greater risk efficiency.
A Sharpe Ratio of 1 or above is generally viewed as an indicator of sound risk adjusted
performance. A ratio below 1 may suggest that the return generated did not adequately
compensate for the volatility experienced. The ratio is most useful when comparing funds from the same
category.
Sortino Ratio
The Sharpe Ratio considers all fluctuations as risk, including both upward and downward movements. However,
investors do not usually view a strong upward movement in the same way as a steep decline. The Sortino Ratio
addresses this difference by considering only downside volatility.
For example, suppose most of Rohan’s fluctuations were caused by periods of strong growth, while Meera’s
fluctuations resulted from sharp declines. The Sharpe Ratio may treat both movements similarly. The Sortino
Ratio would score Rohan’s fund more favorably because its volatility occurred primarily on the upside.
For long term portfolios, the Sortino Ratio can provide a clearer understanding of the risk that may
actually reduce capital or test an investor’s ability to remain invested.
Jensen’s Alpha
Jensen’s Alpha compares the actual return generated by an investment with the return it was expected to
generate after considering market risk. For example, if a mutual fund delivered
14% while its expected return based on the benchmark and risk exposure was
12%, its Jensen’s Alpha would be positive 2%. A positive alpha indicates
that the investment generated a return above its risk-adjusted expectation.
Risk Exists Beyond Equity Market Volatility
Interest rate risk: Bond prices may decline when interest rates rise. If a bond has a modified duration of two years, a 1% rise in interest rates may result in an approximate 2% decline in its price.
Credit risk: This is the possibility that a borrower may fail to meet repayment obligations. An AAA rating represents the highest degree of safety regarding timely repayment. Instruments rated below BBB are considered below investment grade and generally carry greater default risk.
Liquidity risk: An investment may not be sold at a fair price when required. In some cases, it may not be possible to sell the investment at all.
Currency risk: Currency movements can affect international investments. If a United States investor earns 6.5% from an Indian bond but the rupee depreciates by 4% against the dollar, the effective return reduces to approximately 2.5%.
Inflation risk: Inflation reduces purchasing power. If an investment earns 6% while inflation is 7%, the real return is negative 1%.
How Asset Allocation Changes Risk and Return
Structuring your portfolio across equity and fixed income directly alters your risk profile and volatility parameters:
| Equity Allocation |
Debt Allocation |
Weighted Average Return |
Three-Year Standard Deviation |
| 100% |
0% |
14% |
13% |
| 80% |
20% |
12% |
10% |
| 60% |
40% |
10% |
8% |
| 50% |
50% |
9% |
7% |
| 30% |
70% |
8% |
5% |
| 0% |
100% |
6% |
1.5% |
(Source: Anand Rathi Wealth Research)
Shifting from a 100% equity model to an 80:20 equity-to-debt asset mix reduces overall portfolio volatility (standard deviation) from 13.0% to 10.0%, while preserving a strong 12% expected return baseline. This optimization creates a far more stable environment for multi-decade wealth compounding. For details on building this core equity layer safely, explore our guide on portfolio construction for HNIs and building a foundation for long-term wealth.
Practical Action Plan for Building a Risk Conscious Portfolio
Enforce Market Capitalization Rules: Target an optimal equity split containing 55% in large cap, 23% in mid cap, and 22% in small cap allocations to balance growth with downside protection.
Cap Scheme and Fund House Exposure: Maintain between 8 and 10 non-overlapping funds. Ensure no single mutual fund scheme or Asset Management Company (AMC) holds more than 20% of your total capital.
Utilize Systematic Transfer Plans (STP): When deploying a large lumpsum, place the funds in a liquid debt vehicle and transfer fixed amounts into equity schemes weekly or monthly to average your entry costs smoothly.
Incorporate Dedicated Liquidity Reserves: Keep near-term capital requirements completely insulated in short-duration instruments so equity holdings remain undisturbed during market corrections. To examine how to structure this safety net, see our blueprint on liquidity planning in large portfolios.
The Long-Term Impact of Risk Adjusted Returns
A portfolio should not merely aim to generate the highest possible return. It should seek a return that is sustainable within an acceptable level of risk.
A portfolio with more consistent performance can make it easier for an investor to remain committed during market corrections. Staying invested helps protect the compounding process, while frequent exits and changes driven by volatility can affect long term outcomes.
Risk adjusted return therefore provides a more complete perspective. It explains not only where the portfolio finished, but also how efficiently it reached that point.
Understanding Sharpe Ratio, Sortino Ratio, Jensen’s Alpha, standard deviation and asset allocation can help investors build a more disciplined and objective driven investment process.
Conclusion: The True Value of Performance Efficiency
Long-term wealth creation is not about chasing the absolute highest yield in a single speculative bull run. It is about achieving consistent, sustainable growth within acceptable risk boundaries. A portfolio built around risk adjusted efficiency eliminates unnecessary volatility, making it easier to stay invested through full market cycles. By mastering standard deviation, Sharpe ratios, and strategic asset allocation, investors build a disciplined process that protects purchasing power and achieves multi-generational financial goals.
About Anand Rathi Wealth
This article is published by
Anand Rathi Wealth Limited (ARWL),
an NSE500-listed wealth firm established in 2002. ARWL works with
13,941 client families across India and abroad, managing assets of
₹1,06,300 crores across 18+ cities in India, alongside a dedicated
international presence in Dubai and the UK..
ARWL operates as a CFO for personal wealth, bringing objective-driven
portfolio construction, an uncomplicated process, and a long-term
perspective that prioritises consistency of outcomes over short-term
performance.
Our Approach to Investment Insights
At Anand Rathi Wealth, every insight is grounded in data, structured
around a clear investment objective, and designed to be understood
without jargon. The goal is not to impress—it is to inform.
The insights in this article are designed to encourage evaluation of
consistency over isolated returns, highlight the value of structured
portfolio frameworks, and support informed decision-making.
This article has been reviewed for factual accuracy by Anand Rathi
Wealth Limited's insights function. This content is for informational
and educational purposes only. It is designed to help readers make
informed financial decisions.
To understand how this content is created and reviewed, visit our
Content Standard Page.
Disclaimer
This article is for informational and educational purposes only. The fund and scheme names used in this article are illustrative examples for explaining diversification and overlap. They should not be treated as investment action, product endorsement, or a promise of future performance.
FAQs
Risk adjusted return measures the profit an investment generates relative to the explicit amount of risk taken to achieve that gain. It helps investors evaluate whether a fund's outperformance was earned through sound strategy or by taking on excessive market volatility.
The Sharpe Ratio treats all price swings as risk, penalizing both sharp downward drops and strong upward rallies equally. The Sortino Ratio isolates only downside volatility, providing a more accurate reflection of the true drawdown risks that could impair capital.
Jensen's Alpha measures the performance of an asset against its expected baseline derived from its market risk exposure. A positive alpha confirms that the manager generated excess returns beyond what simple market exposure would have delivered.
Yes. Adding a 20% allocation of low-volatility fixed income to an all-equity portfolio significantly reduces standard deviation while preserving a strong long-term compounding return baseline.